



Moving Average Crossover Strategy: Types, Signals and Trading Rules


Among the many indicators you can use to study market trends, moving average crossover strategy is perhaps the simplest way to spot a potential change in market directions.
The moving average crossover strategy uses two averages: a fast-moving average and a slow-moving average to identify momentum shifts. However, these averages rely on historical prices, which may lead to a false signal or late confirmations.
But how does a moving average crossover actually work? What are its types, its settings, its execution, and how do you choose the right settings? Let’s break it down in this blog.
What Is a Moving Average Crossover Strategy?
Moving averages crossover strategy is a form of technical analysis where you can track the intersection of two different average prices over a time period.
In this strategy, the fast moving average tracks a shorter timeframe (e.g., 10-day average) with fewer candles and sudden price changes whereas the longer timeframe is tracked by the slow moving average (e.g., 50-day average). The latter reflects a broad market trend, with smooth price fluctuations.
How Fast and Slow Moving Averages Work Together
A moving average calculates the average price of an asset over a set number of past candles or days (known as the "period length"). It does not care about the individual rise or fall of prices, but helps you to determine the general direction in which the price is moving.
Fast-moving average is more responsive as it tracks the shorter period. This makes
the average quicker to react but more sensitive to temporary price changes and vice versa.
Besides, the slow-moving average smoothens the effect of short-term price fluctuations.
For instance, a stock might rise one day and fall the next sharply. While the 10-day average will observe these movements quickly, the 50-day average will show less effects as it includes historical prices.
Now, why do the two lines converge, cross or separate:
- The lines converge when the difference between the two averages gets smaller in a sideways or range-bound market.
- The lines cross or intersect when the fast average moves from one side of the slow average to the other. That is, there is a sudden influx of buyers & sellers in the market, the fast line moves suddenly, reflecting these changes and cuts through the slow line. That is where the crossover happens.
- The lines move apart when the difference between the averages grows again. That is, once a market trend gains some traction, the fast line races ahead into the new direction, while the slow line takes time to catch up.
Bullish and Bearish Crossover Signals
The crossover movement defines the trend of the market, however, it is by no means a guaranteed buy or sell signal.
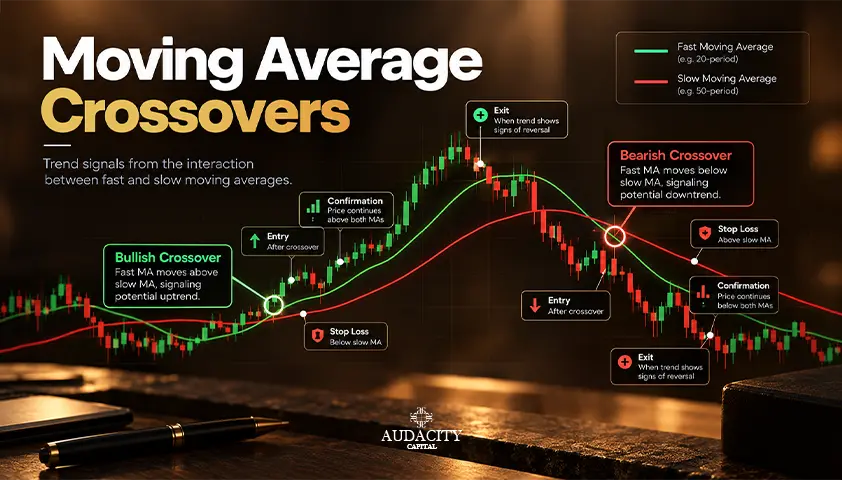
1. Bullish Crossover: When the fast moving cross above the slower moving average, it usually signals a bullish trend.
Consider this, when the 10-day moving average is below the 50-day moving average, it reflects a downtrend. But when the former crosses above the latter, it usually signals the start of a bullish trend.
2. Bearish Crossover: A bearish crossover occurs when the fast moving average crosses below the slow-moving average.
For instance, if the 20-day moving average falls below the 50-day moving average, it indicates a bearish trend, prompting buyers to consider short-sell or exit strategies.
A Crossover Signal Is Not a Complete Trade
When the two averages intersect, it does not signify a trading plan or how the price will move next. Rather it reflects a change in relationship, which helps to formulate your trading plan.
Your strategy must depend upon market conditions, an idea that will confirm your entry, an invalidation point, risk factors and exit.
While a crossover determines the relationship between two averages, a trading plan determines whether to act or not act on that change.
Moving Average Types Used in Crossover Strategies
Simple Moving Average (SMA)
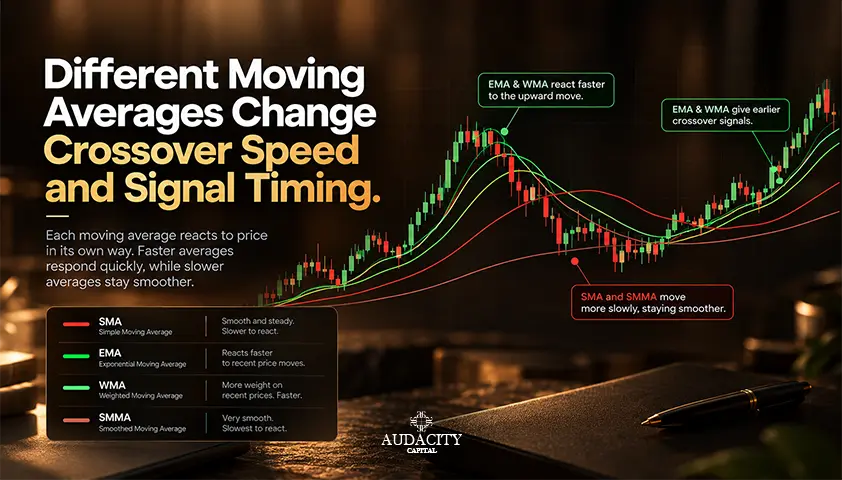
SMA or Simple Moving Average gives equal weight to every price within the selected timeframe. This approach makes the line smoother and slow to react to sudden price changes.
SMA is a popular choice to anticipate long-term trading such as 50-day & 200-day. However, the slower response means a crossover may occur after a price move has already begun.
Exponential Moving Average (EMA)
An Exponential Moving Average or EMA assigns more weight to the new prices and progressively less weight to historical ones.
EMA is quick to react to price changes, and may cross another average earlier and more frequently, especially in sideways or volatile markets, leading to false signals.
Weighted Moving Average (WMA)
WMA uses a fixed, linear increasing set of weights to new prices so the recent changes have a larger impact on average. It is considered as a balanced approach, between SMA and EMA, however, it is not automatically superior or better than either.
Hull and Smoothed Moving Averages
The Hull Moving Averages combines weighted moving averages calculated over different periods to eliminate lag entirely while keeping the line smooth.
A Smoothed Moving Average utilizes vast amounts of past data to create an ultra-smooth line that ignores extreme price swings.
In a crossover strategy, you may consider SMMA as the slower line to understand the broader market trend. The smooth movements will ignore the minor price fluctuations, but a genuine change in market trend will take longer to appear in the crossover.
The section below compares different types of moving averages:
MA Type | Assigned Weight | Speed | Use Case | Trade-Off |
SMA | Treats every day equally | Slowest | Long-term trend watching | Slow to react; you might enter a trade late |
EMA | Focuses heavily on recent days | Fast | Short-term fast trading | Sensitive to small price spikes; triggers false signals |
WMA | Drops importance step-by-step | Moderate | Balanced trend tracking | A middle-ground option, but less widely used |
HMA / SMMA | Uses special mathematical formulas | Very Fast (HMA) / Very Slow (SMMA) | Specialized chart filters | Harder to set up and less standard for beginners |
Types of Moving Average Crossovers
Lets discuss below the type of moving averages crossovers:
Price and Moving Average Crossover
Price and moving average crossover happens when an asset’s closing price crosses above or below the single moving average. This approach is used in fast-moving markets or by short-term traders assessing instant momentum shifts. However, one drawdown is whipsaws where the price constantly crosses back and forth leading to false signals.
Double Moving Average Crossover
A double moving average crossover is observed when the fast moving average crosses the slow moving average. This is the standard definition of a moving crossover strategy as it determines the relationship between two averages to identify market trends.
Triple Moving Average Alignment
This approach uses three averages: fast-moving (10-day), medium-moving (30-day) and slow-moving (50-day) to study market directions and need more confirmations.
Golden Cross and Death Cross
Golden Cross and Death crossovers are usually assessed using a double crossover strategy with 50-day and 200-day moving averages. These crossovers reflect more of a confirmation for macro-trend rather than an entry signal.
A golden crossover occurs when the 50-day moving average crosses above the 200-day moving average. It signals an upward trend, or the potential start of a long-term bullish market.
In contrast, a death crossover occurs when the 50-day moving average crosses below the 200-day moving average, reflecting a downward trend.
Moving Average Ribbon
A moving average ribbon utilizes various moving averages with different time periods, plotted on the same price chart. This strategy does not rely on a single event, rather it tracks how averages converge, move apart, or change their orders.
Double Moving Average Crossover Strategy
The double moving average crossover depends on two average price lines. It consists of one fast-moving average and a slower-moving average. When these two average lines intersect, it can signal a change in market trends.
Bullish and Bearish Rules
This is how you spot the market trend using double moving average crossover:
- Bullish: The fast average crosses above the slow average, wherein, the buyers are pushing prices higher and faster than the long-term average.
- Bearish: The fast average falls below the slow average, wherein, sellers are dominant and weakening the prices.
The complete candle rule dictates that you should never execute a trade at the moment when the second line crosses mid-candle. This rule helps you to stop acting on false breakouts or misleading signals.
It is important that you wait for the candle to close and then act on it
Entry and Exit Choices
There are three ways to enter the trade:
- The Crossover Entry: Enter the trade as soon as the crossover is confirmed, as in, immediately as the candle closes. While you won’t likely miss a major move, it may increase chances of a fake start.
- The Retest Entry: In this strategy, you wait for the price to pull back and touch the moving average line after the cross. This gives you a more solid confirmation and a discounted entry.
- The Structure-Break Entry: You wait for the price to break a recent swing high or low in the direction of the cross. This adds an extra layer of confirmation. However, it comes at the cost of entering slightly later.
For exits, likewise there are three ways:
- Opposite-Cross Exit: Exit when both the averages cross in an opposite direction.
- Trailing Exit: Move your stop-loss order progressively closer as the price moves in your favor, locking in gains automatically.
- Target-Based Exit: Set a fixed profit and exit automatically when hit.
Triple Moving Average Crossover Strategy
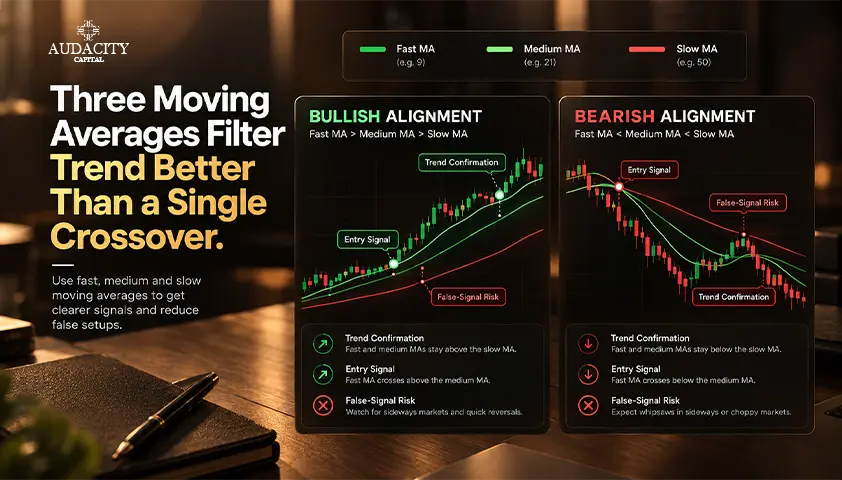
The triple moving average crossover makes use of three averages: the fast average reflects recent price movements, the medium average shows the direction over a longer period, and the slow average provides a broader market trend.
The third average adds an extra layer of confirmation. You don’t have to rely on a single crossover, instead you can check if the short and medium-term trends align with the long-term movements.
Sequential Cross Versus Full Alignment
A sequential crossover strategy acts when the averages cross in a particular order or occurs step-by-step. For instance, in a bullish trend:
- The fast-moving average crosses above the medium-average.
- The medium average crosses above the slow-average
On the other hand, full alignment requires that you don’t enter until all three lines are cleanly stacked in the exact correct order (Fast above Medium, and Medium above Slow).
10/20/50 Rule Set
Many traders follow the 10/20/50 rule set to test trades. This is how it works:
Bullish Alignment: The 10-day MA sits above the 20-day MA. The latter then sits above the 50-day average.
Bearish Alignment: The 10-period sits below the 20-period, and the 20-period sits below the 50-period.
Exit Rule: The trade’s exit rule states that you must close the position when the fast-moving average (10) crosses the medium-average (20) in the reverse direction.
When Three Averages Add Too Much Lag
Moving averages are based upon historical prices, which means they miss the action of the live markets. You wait for the confirmation but by then the prices have moved significantly, which delays your entry, squeezes your margins, & also affects your exits.
Moving Average Ribbon Strategy
The moving average ribbon crossover uses a set of short-to-long averages (often 6 to 8 lines) plotted together. As a result, you get a visual band that twists, expands, and compresses like a fabric ribbon, which indicates the broader market trend.
Ribbon Expansion and Trend Strength
When averages get arranged in the same direction and the gap between them widens, the ribbon is expanding. This signals a change in market trend.
The slope will define whether it's a bullish or a bearish trend. When averages slope upwards, it reflects a bullish trend and when the averages slope downwards, it reflects a bearish trend.
Consider this example for a bullish trend. The 5-day average rises above the 10-day average, followed by 20, 30, and 50-day average. The gap between them widens as the prices rise; so you may look for opportunities to use minor price dips to buy into the buying momentum.
Ribbon Compression and Transition Risk
When the averages come close together, cross frequently, or become nearly flat, the ribbon is compressing. This is indicative of low momentum and low volatility, usually observed in a sideways market.
It is worth nothing, that you may treat compression to opt out of the trades. Do not treat a squeezed ribbon as a breakout prediction, instead wait for the lines to separate or re-expand.
How to Build a Complete Moving Average Crossover Setup
Identify the Market Condition
To test the market conditions, you must assess if the prices are moving consistently in one direction or are trading between a range. If averages cross frequently, but the price stays between the range, wait for a more clear signal.
E.g., If the 10-day period & 30-day averages cross three times while EUR/USD remains between 1.0800 and 1.0830, wait for the price to break out.
Define the Crossover Precisely
Note down the type of moving average, the time periods, the price inputs, chart timeframe before testing your strategy. Watch for the fast-line to cross completely the slow-moving line and never act while the candle is still forming.
Add Price Confirmation
Don’t just act on crossover alone. Wait for the price movement to align with the crossover, either with a retest, breakout or agreeing with higher time-frame.
For instance, in bullish trends, wait for the price to break above the recent highs or swing or retest the moving averages and then rise again.
Set Entry, Invalidation and Exit Rules
Decide on your entry, exit, and invalidation rule; before entering a trade.
- Entry: Place a buy-stop order just above the high of the confirmation candle, or enter a limit order when the price pulls back to fast-moving MA.
- Invalidation : Set your initial stop-loss below the most recent swing low or high. If the price crosses back across the slow moving average, close the position immediately regardless of your stop-loss.
- Exit: Exit the trade at a predetermined target, usually a major resistance or trail your exit as long as the trend holds.
Apply Risk and Cost Rules
It is also important to consider the risk and cost. Calculate your position size, use a fixed limit per trade, account for trading cost, spreads and slippage before entering a trade. Avoid entering a trade just before a major economic or corporate announcement.
How to Choose Moving Average Crossover Settings
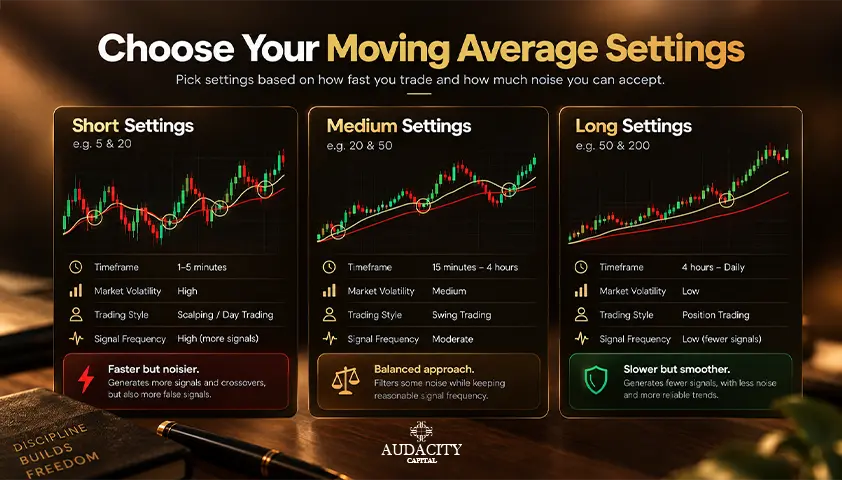
A moving average crossover setting depends on several factors, such as, price reactions, holding period of trade, asset class, and overall market volatility.
Short-Term References: 5/20 and 9/21
These pairs are quick to react to live price swings as they rely on short averages. It is suited to trades who may look for earlier entry signals on lower time periods.
During volatile market sessions, these references may cause the fast line to cross back and forth repeatedly, generating multiple losing trades (whipsaws) and cutting into the profit margins with spread and slippage costs.
For instance, a five-minute chart of EUR/USD may observe a 5/20 crossover when price swings suddenly. But if the reversal is as quick as the swing, the average may cross back and confirm a false signal.
Medium-Term Reference: 20/50
These pairs are slow to respond as compared to shorter combinations. Medium term references shut out the false noise, and also capture multi-day swing trends. Generally, it is used by traders who are still tracking trends or assessing pullbacks during trend changes.
For example, a trader may use the 20/50 crossover to identify an upward trend, then wait for a pullback before entering instead of buying immediately after the averages cross.
Long-Term Reference: 50/200
Long-term references with 50/200 averages are used for tracking macro trends across daily and weekly chartframes.
However, there’s a severe lag across these pairs as they react so slowly that the market has often completed a significant portion of its total move by the time a cross triggers, making it unsuitable for intraday or fast markets like forex moving average crossover strategy, where timing is of utmost importance.
Match the Pair to the Timeframe and Holding Period
To get the most of your strategy, do not choose a specific pair because it produced the highest backtest returns on past data (curve-fitting). Instead, test parameter ranges, such as evaluating how performance shifts across 8–12 fast periods combined with 20–30 slow periods, to ensure your setup is resilient across different market conditions.
Why Moving Average Crossover Strategies Give False Signals
Let's explore the reasons as to why a moving crossover strategy may generate false signals:
Whipsaws in Sideways Market:
A whipsaw occurs in a range-bound market. When moving averages cross and suggest a potential trend then reverse back in the opposite direction. This leads the moving average lines to intersect quite frequently.
For instance, a stock trades between ₹480-₹500. However, when the 10-day MA crosses above the 30-day average and subsequently the price rises towards ₹500. You may enter a trade at that point, but the price falls back to ₹480.
The average will move below, signalling a downtrend, in which case you may exit. However, the cycle repeats again when the stock rebounds and MA lines will cross upwards again.
Lag and Late Entries
A crossover seeks to confirm a price movement rather than predicting its beginning. Due to severe lags, many times crossovers occur when much of the price movement has already happened. In this case, entering late has already chipped at both your stop-loss and profits.
Filters That Answer a Specific Question
Use filters to back your predictions:
- Price structure: Does the price movement confirm the trend? Has it broken through a major resistance or support in the expected direction?
- Higher-timeframe trend: Does the higher timeframe or the broader chart supports your trade directions?
- Average Directional Index (ADX): Is the trend strong enough to justify a trend-following strategy?
- Average True Range (ATR): Is there sufficient market volatility to book profits and cover costs? Is the current price movement large enough to justify the stop-loss and exit targets?
- Support and resistance: Is the trade running into a price area where reversals or hesitation may occur?
It is advised to avoid "indicator stacking” ( adding 4 or 5 extra indicators at once).
Write a No-Trade Rule
Decide when you will skip the trade. It can use conditions like:
- The averages are flat or tangled: The fast and slow lines are horizontal or crossing back and forth within a narrow channel.
- The price is overextended: The signal candle closes too far from the slow average or nearest structural support/resistance.
- Transaction costs makes the trade unviable: The distance to target is too small relative to live bid-ask spreads and volatility levels.
How to Backtest a Moving Average Crossover Strategy
Listed below is the framework with which you can backtest a moving average crossover strategy:
Test the Complete Rule Set
Your trade test must mirror the live market conditions. It should explicitly define your confirmation idea, entry, invalidation, stop-loss, risk, exit targets, and strict no-trade conditions. Also account for broker spreads, execution slippage to prevent errors.
Review More Than Win Rate
A win rate is not the sole factor in testing the strategy’s success. You must also measure:
- Net return: Profit or loss after trading costs.
- Maximum drawdown: The largest decline from a portfolio peak to a subsequent low.
- Profit factor: Gross profits divided by gross losses.
- Expectancy: Average profit or loss per trade.
- Trade count: The number of trades behind the results.
- Average win/loss: The usual winning trade compared with the usual losing trade.
Check Robustness, Not the Best Historical Pair
Try to avoid the practice of curve-fitting- that is, optimising your settings to match the chart data. Instead, try the following measures:
A: Test your strategy and results across different market conditions such as trending, volatile and sideways markets.
B: Compare nearby settings, such as 8/20, 9/21, and 10/22, without changing other rules. If performance collapses after a small adjustment, the original result was too reliant on a particular combination.
Which Moving Average Crossover Strategy Fits Which Use Case?
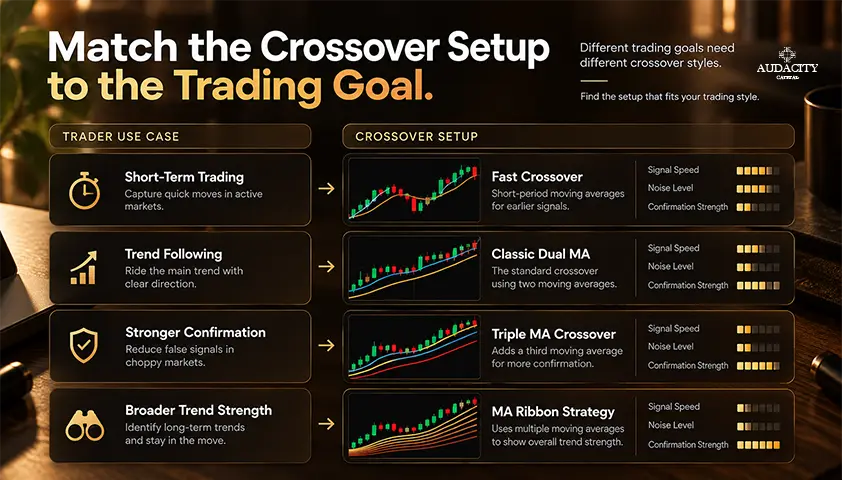
There’s no single moving average crossover strategy that works across all market conditions. Instead, the strategies are suited to different conditions such as:
Intraday Breakouts: Opt for a double moving average or shorter timeframe pairs like 5/20 to capture the momentum.
Multi-Day Trend: A triple moving average or a moving average ribbon is best suited as it filters the noise, and also adds an extra confirmation layer.
Macro Trends: You can rely upon the 50/200 Golden/Death Cross to track the macro trends.
Strategy Type | Averages Used | Signal Logic | Relative Speed | Use Case | Weakness |
Price / MA Crossover | Price line and a single moving average. | Price crosses above or below the single baseline | Very Fast | Quick momentum spike, simple baseline tracking | High chances of false-signals in choppy markets. |
Double MA Crossover | Fast and slow-moving averages | Fast line crosses completely over slow line | Moderate | Intraday trend trading, session breakouts | Vulnerable to whipsaws during sideways markets. |
Triple MA Crossover | Fast, medium and slow-moving averages. | Sequential cross or full alignment | Slow | Multi-layered trend filtering, swing trading | Severe lag causes delayed entries and exits |
MA Ribbon | Short-to-Long Set of moving averages (6 to 8 lines) | Ribbon expansion,compression, and slope | Variable | Identify momentum shifts and trend strength | Difficult to codify precise mechanical rules |
50/200 Golden/Death Cross | 50-period MA + 200-period MA | Long-term macro baseline crossover | Very Slow | Long-term investing and macroeconomic context | Severe price lag; unsuitable for short-term entries |

Start Your Funded Trading Journey
Funded Trader ProgramConclusion
The bottom line is, a moving average crossover is not a confirmation of a trend. Rather it is one of the many signals that help you assess market direction. The choice of moving average, its structure, crossover settings also varies as per the trade.
Whether a trade is worth being acted upon depends on not just the crossover element, but factors like market conditions, entry, exit and invalidation triggers, risk appetite, and comprehensive risk management.
All in all, moving average crossover can be a useful part of your trading strategy, when executed with well-defined rules and a disciplined approach. Also, explore Audacity Capital resources market insights, trading guides and strategy lessons.
Guides About Trading Strategies
- Best Forex strategy for consistent profits
- Fundamental Analysis Strategies in Forex
- Trading Forex Without Leverage
- Forex Leverage Trading Strategies
- Forex Swing Trading Strategies
- Hedging Forex Trading Strategies
- Forex Scalping Trading Strategies
Frequently Asked Questions
A moving average crossover strategy uses a fast and a slow moving average to study market trends. However, by no means, the crossover alone signals a confirmation of the market move.
There’s no best moving average for a crossover strategy since every type has its own quirks. For instance, SMA smoothens the price fluctuations, EMA is sensitive to price movements while WMA acts as a middle ground between the both, and gives greater weight to recent prices. The right choice is dictated by market conditions, trading setup and other factors.
The ideal crossover period relies on asset class, cost, backtest performance or trading setups. Usually for short-term or scalping 9/21 reference, 20/50 for swing trading, and 50/200 for long-term trend identification are used.
Neither can be picked up as the clear winner. SMA is slow to respond to fluctuations and may come with a lag. On the other hand, EMA is sensitive to price movements, catches signals early but also leads to misleading signals.
Yes. It should always be a rule to never act on a candle which is still forming as it may lead to errors. Always wait for a candle to form completely, wait for confirmation from other elements and then take a decision.
Due to range-bound markets, delayed signals, late entries, and frequent crosses in a volatile market, moving averages may fail. crosses during price fluctuations.
Yes, moving averages crossover strategy can be used in forex. It is advised to consider other factors such as currency pair, timeframe, trading session, volatility, spreads, and slippage. You must also test the strategy under different market conditions, across historical prices and define your entry, exit, rules in advance.

Ready to apply disciplined risk to crypto? Explore Audacity Capital's new crypto instruments and bring your trading strategy.
Learn MoreNewsletter
Join our newsletter to stay up to date on features and releases.
Join Our Social & Community

Start Your Journey Today With Our Free Trial
Proudly showcase your skills and accomplishments through certificates and get recognition for your hard work and dedication from potential investors and peers.
Free TrialRelated Articles
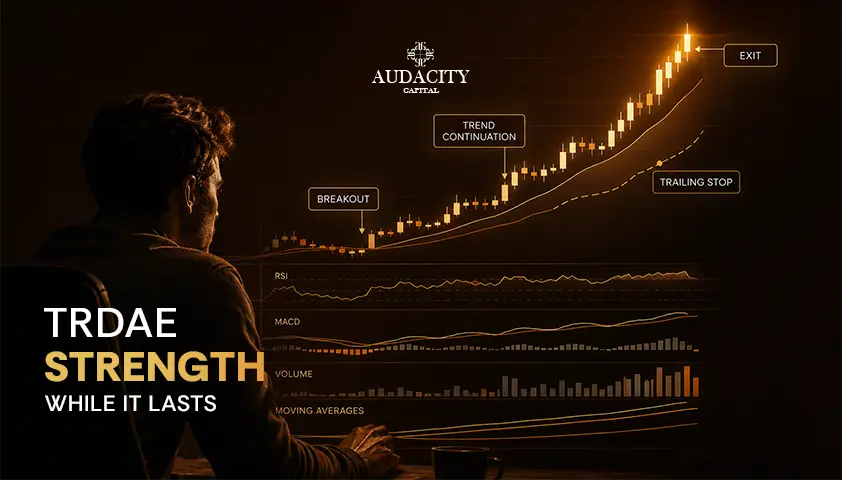
Momentum Trading Strategy: A Comprehensive Guide
Master the core principles of a momentum trading strategy. Learn how to use key indicators, manage sharp-reversal risks, and master exit timing.

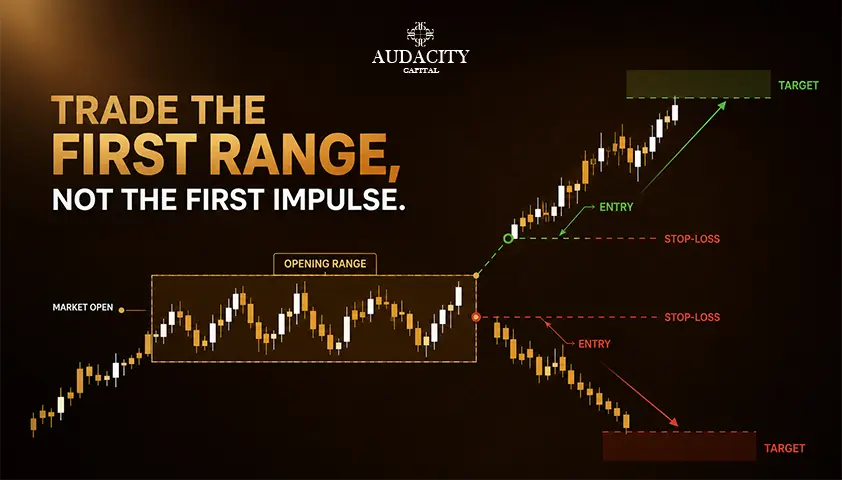
Opening Range Breakout Strategy: Rules, Setups and Examples
Learn how the opening range breakout strategy works, including ORB rules, 5, 15 and 30-minute setups, entry signals, stop losses and risk management.
Inside Bar Trading Strategy: Rules, Entries and Backtest Guide
Learn a rule-based inside bar trading strategy. Get the pattern definition, three entry models, stop and target logic, and a backtest framework for your market.
Inside Bar Trading Strategy: Rules, Entries and Risk Guide
Master the inside bar trading strategy with practical rules for pattern identification, entry triggers, stop placement, risk management, and testing.