



Day Trading for Beginners: How to Start Step by Step


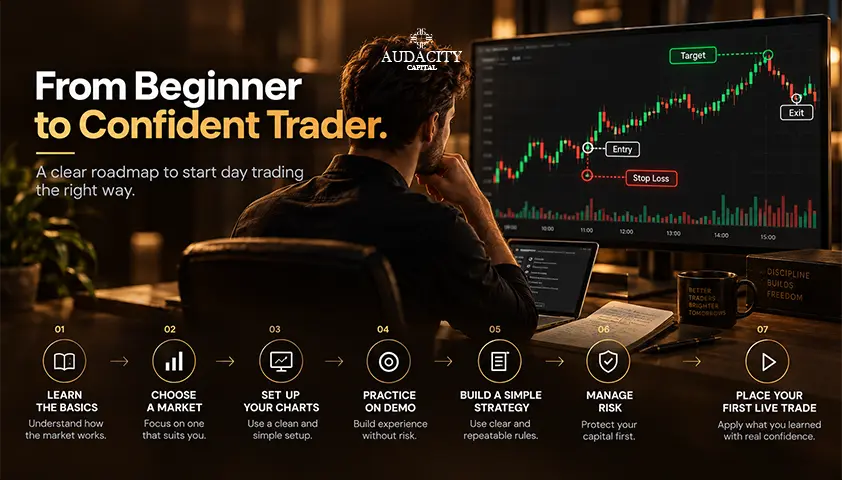
Day trading is often viewed as a quick way to make money. However, reality is vastly different. It involves sudden price swings, liquidity issues, high-volatility, and short holding periods that leaves little room for careless decisions.
Day trading for beginners must be considered as a skill-building exercise, where traders must first learn market conditions, trade setups, risk management and execution.
In this blog, we’ll break down this process step-by-step. Traders can understand markets, learn how to start day trading, define their risk, focus on one trading setup, build a plan, practise with a demo account, maintain a trading journal and review their progress before moving to live markets.
Learning how to do day trading starts with understanding the market, order execution, risk, and a repeatable process rather than rushing into live trades.
What Should You Know Before You Start Day Trading?
Before traders learn day trading, it is important to assess what it demands from a trader.
Day trading requires:
- Continuous attention
- Faster execution due to highly volatile and highly liquid trading activity
- The ability to view losses objectively
- Handle amplified losses and risks due to leverages.
- A structured approach towards process, execution quality, risk management and consistent strategy.
Many beginners focus on daily income targets and to fulfill those targets risk their essential livelihood. This approach, on both the fronts, is wrong. Trading comes with a certain financial responsibility, and only those individuals should partake who can commit to this.
Step 1: Learn the Basic Trading Concepts
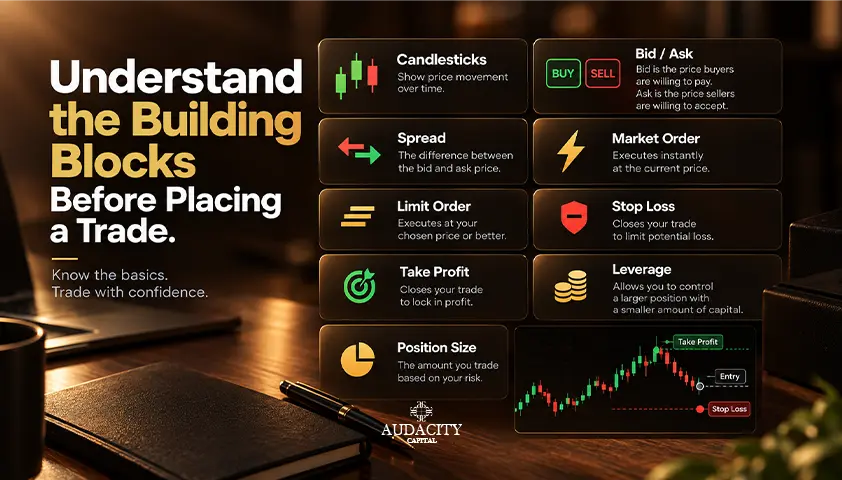
It's important to understand the basic trading concepts such as:
Long vs Short
Long position signals a bullish outlook, which means a trader expects the prices to rise in the future, so the trader seeks to buy an asset and profits from selling it later at a higher price.
A short position is an indicator of a bearish market, where prices are falling. This means selling the asset first at a higher price and buying it later at a much cheaper price.
Bid, Ask and Spread
Buyers and sellers have different prices at which they seek to trade. The bid is the highest price the buyers are willing to pay whereas the ask is the lowest price at which the sellers are ready to sell. The difference between bid and ask is known as spread.
Moreover, the intended price for your trade will most likely differ from the execution price. While a trader may place an order at $99, the buying price may move up to $101 before the order is fulfilled. Therefore, it helps to look at the bid ask and spread to understand the pricing differences.
Market, Limit and Stop Orders
There are three common order types:
- Market Orders: Buy and Sell at the best available price or the current market price. These orders execute trade instantly, prioritize speed and come with a small variation. For instance, a stock may trade at $102. When you place a market order, the execution price may differ and may goes to $102.50 or less or more.
- Limit Orders: Buy or sell at the predetermined price. While it gives you more control over the trade, it does not guarantee execution. The trade will go through only if the price hits.
- Stop-Orders: Stop orders act like automated triggers wherein the order stays hidden until the price reaches a specified level. The trade then is executed at market price. For instance, a stock trades at $100, and the trader sets a stop-loss of $105. When the price is $105 or more, the stop-order gets triggered and the trade gets executed at the current market price.
Stop-Loss and Take-Profit Orders
Stop-loss and take-profit orders help you exit a trade.
Stop-loss helps traders to limit losses as they automatically exit a trade when price moves reach a specified price. This helps you to make a planned exit in advance rather than making a decision under pressure.
Take-profit orders help you secure a potential gain and take an exit when price reaches a certain level. You buy a stock at $100 and set a Take-Profit at $130. The stock climbs to $130 during lunch while you are away from your phone. Your platform automatically closes the trade, locking in your $30 profit.
Leverage and Margin
Leverage and margins allow you to trade larger positions than your cash balance allows.
Leverage is the borrowing power provided by your broker expressed as a ratio, such as 5:1 or 10:1.
Consider a 10:1 leverage. You use your $10,000 as margin to control a $100,000 position.
- If the price rises by 10%, your position gains $10,000. You double your money with a 100% gain on your original $10,000.
- If the price drops by 10%, your position loses $10,000. You face a 100% loss, wiping out your capital completely.
The margin, however, is the initial deposit of cash required to open and maintain a leveraged trade. It acts as a collateral deposit held by your broker while the trade is open.
You provide $2,000 to control a $10,000 position. That $2,000 is your initial margin. While leverage and margins can amplify gains, it also poses a risk to your capital and amplifies your risk and losses too.
Step 2: Choose One Market to Learn First
Here are some factors to consider while selecting a market:
- Trading hours: Trading hours differ by market type. While some markets are open throughout the day, others operate across fixed hours.
- Liquidity: The metric tells how easily an asset can be bought or sold, without having a significant impact on its price.
- Volatility: It is the degree of price fluctuations that is how quickly and by how much the price moves.
- Leverage: Leverage refers to the ability to trade larger positions with small cash upfront.
- Complexity: Some markets and asset types are easier to understand than others. A market based on buying and selling shares is easier to comprehend than learning one which consists of contracts , multiple pricing factors, or complex strategies.
- Learning curve: Before trading, it is important to understand how much total time and effort is needed to understand the markets. Traders may need to understand market mechanisms, company performance, economic releases, events, etc.
Depending upon these factors, traders can select any of the five markets from below.
- Stocks: Stock markets operate with fixed trading hours where popular stocks have high liquidity and vice versa. Stock prices depend upon company news, quarterly earnings reports, management updates, and sector trends.
- Forex: Forex is open 24 hours a day, 5 days a week. Major currency pairs, such as EUR/USD come with high liquidity and high leverage while less commonly traded pairs may have wider spreads and low liquidity.
- Futures: Futures have extended market sessions nearly 24 hours a day during the business week and also pose high leverage and contract sizes.
- Options: Options follow the trading sessions of the exchange and the underlying markets. They also come with expiry dates and these markets are more complex than others.
- Cryptocurrency: The cryptocurrency market operates 24 hours a day, seven days a week. Popular currencies have high liquidity while these markets or assets also have high volatility.
Step 3: Understand Trading Sessions and When Your Market Moves
Prices throughout the market hours experience sudden highs and lows of fast activity, slow movement, or high volatility around planned economic events.
Market Timings and Opening Bells:
Traders are active when the market opens as they react to news outside the trading hours (overnight price movements, surprise events or new orders). This information leads to gaps between opening prices and closing prices.
Similarly, traders become active when the closing bell nears as they seek to adjust their positions. For instance, London Forex Session is 08:00 to 17:00 UTC, whereas New York Forex session is between 13:00 to 22:00 UTC.
High and Low Liquidity Periods:
High liquidity periods such as opening or closing bells observe more active buyers and sellers which leads to easy entry and exit, faster execution, tighter spreads and smooth price charts.
On the other hand, low liquidity like the lunch breaks or the midday means less participation from traders, where prices observe wider spreads and lead to unpredictable movements.
Scheduled news and economic events:
Government agencies, companies and statistics forums publish data such as corporate earnings, company-related news, inflation or economic data, interest rate or monetary policy updates. The prices may react sharply before or after the announcement.
Master one session instead of trading all day:
Traders must master one trading session which comes with its own price ranges, volatility levels, or risks. This helps to identify opportunities, understand how markets react to the news or sudden announcements, and lead to consistent results.
It is important to note that there’s no best time to participate in a trade. Traders must choose one consistent time, understand the session, and stick to pre-defined conditions.
Step 4: Learn How to Read a Basic Price Chart
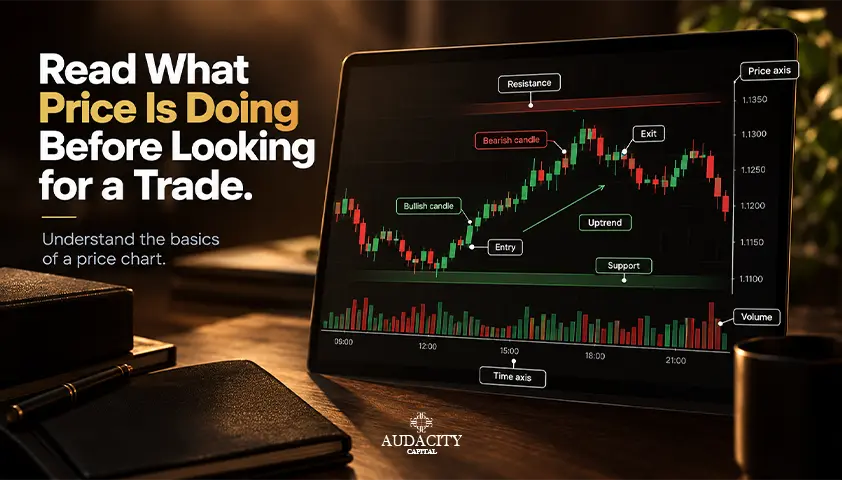
A trader cannot trade without understanding the basics of a price chart. Here are some day tradings basics outlined for the readers:
Candlesticks and Timeframes:
A candlestick shows how the price of an asset moved during a specific period. There are four important aspects of a candlestick:
- Opening price
- Closing price
- High: The highest price point reached during that period (shown as the top thin line or "wick").
- Low: The lowest price point reached during that period (shown as the bottom thin line or "wick").
Also, the same price movements and candle formation can look different across different timeframes such as 1 min, 5 min, 15 min, or a 1 day, 1 week, 3 month, 6 month or more.
Trends and Market Directions:
The direction of the price signals the trend, which can be categorised in three forms: upward (bullish), downward (bearish), and sideways (range-defined movements).
To spot an upward trend, traders need to look at:
- Higher High (HH): When a new price rally breaks above the previous peak price level.
- Higher Low (HL): When a temporary price drop stops at a floor higher than the previous drop's floor.
For instance, a stock rises from $100 to $110, pulls back to $105, rises to $115, and then pulls back to $109. The new peak of $115 is a higher high, and the new low of $109 is a higher low.
To spot a downward trend, traders can look at:
- Lower High (LH): When a temporary recovery rally stops at a level lower than the previous peak.
- Lower Low (LL): When a price drop breaks beneath the previous drop's bottom.
Consider an example, where a stock falls from $120 to $110, bounces to $115, falls to $105, and then bounces to $111. The low of $105 is a lower low, and the peak of $111 is a lower high compared with $115.
However, if the price movement is unclear and there are no higher highs or lower lows, the market may be moving in a sideways trend. This is usually accompanied with a pre-defined range where the asset trades between a certain price range.
Support and Resistance:
These are horizontal lines with price levels where the market has struggled to push the prices higher or lower, or the prices signal a reversal.
Support: The area where buying interest has previously helped slow or stop a price decline. If the stock keeps falling to $200 and keeps rising again, then $200 is a crucial support.
Resistance: The level where selling interest has slowed down and stopped a price from rising higher. If the asset’s price rises to $300, but does not move beyond that, it means selling pressure has increased across that level.
Volume and Volatility:
Volume means how many shares or contracts were traded during a particular period. On a five-minute chart, for example, the volume may show how many shares or contracts were traded during that five-minute candle.
Volume adds context to the price move. A bar that stands 2x or 3x taller than average bars signals strong volumes. If a price breaks above a Resistance ceiling on high volume, it indicates strong interest and a genuine move.
Volatility on the other hand measures how fast and wide the prices swing. High volatility is where prices move in sudden swings within a short time. Whereas, low volatility observes less price movements and narrow range.
Step 5: Understand Your Risk Before Choosing a Strategy
Risk management is one of the most important aspects of trading. Here’s how traders can go about it:
Decide How Much You Can Risk: To understand how much day trading risk you can take, understand these technologies first:
- Account Size: The total cash balance sitting in your trading account. Lets say $1,000,000
- Amount at Risk: Amount you are willing to lose if a single trade goes completely wrong. Traders cap their risk 1-2% of their total account size, which is $10,000.
- Position Size: The no. of shares, contracts or assets you are trading. If the entry point is $500, and stop-Loss is at $450. The risk per share is $50. To calculate the position size, you can divide maximum risk by price per share. That is $10,000/ $50 = 200 Shares.
Position size thus helps you to determine how many shares or contacts you must buy if the trade does not go as planned. In this scenario, even though buying 200 shares requires $100,000 in capital, your actual risk is strictly $10,000 if the price drops to your $450 stop-loss.
Know Where the Trade Is Invalid
Stop-losses must be placed at exact chart levels where the trade thesis is proven wrong. The stop-loss amount must be as reasonable as the entry point; it should not be an arbitrary amount that seeks to round off a loss. To determine a stop-loss, consider these scenarios:
- If you buy because you expect support to hold, a move clearly below that support area may weaken or invalidate your idea.
- If you buy because the price breaks above resistance, a move back below the breakout area may suggest the breakout has failed.
- If you sell because the price is making lower highs and lower lows, a strong move above an important lower high may challenge your idea.
Risk to Reward Ratio:
The ratio measures how much you are willing to risk compared to how much you will gain. To calculate this ratio, traders divide the potential loss by potential profit.
There’s no magic ratio that guarantees a reward. Instead, more often than not traders observe differences due to slippage, gaps and costs. However, this ratio proves useful as to whether a trade is worth considering or not?
Set a Maximum Daily Loss:
After incurring two or three losses, traders may engage in emotional trading. Setting a daily limit loss helps to avoid this situation. Stopping early stops traders from a large potential loss. To set a daily loss limit, traders can first determine how much of their account they’re willing to lose in a single day. This can either be a fixed amount or a certain percentage of their account size.
Step 6: Learn One Day Trading Setup First
Successful trading does not mean experimenting with five different strategies. Rather, beginner day trading must first concentrate on a single day setup with a well-defined strategy.
However, it is important to first understand three setups:
1. Breakout Setup: Breakout trade happens when prices move past their resistance levels, supported by strong volumes.
2. Trend Continuation (Momentum) Setup: When a stock moves steadily in a consistent direction, traders may participate in momentum trading. Instead of chasing a price while it is climbing, traders wait for a short pullback to a crucial support area, then enter in the direction of the main trend.
3. Range (Mean Reversion) Setup: Range trading occurs when prices bounce back and forth between two determined boundaries. This trade is used in flat, sideways markets that lack a clear overall directional trend.
Here’s how to identify a setup:
A. Identifiable market condition: Understand market conditions and assess breakout conditions, trends, or range. If the market does not match your criteria, skip the trade.
B. Clear entry trigger: Specify the exact price event that gives you permission to open the trade. For example, you may require the price to move above a resistance level and meet a specific confirmation rule.
C. Clear invalidation level: Understand when, where and how will your trade idea be proven wrong. Instead of hoping for a market reversal, follow a clear exit plan and act accordingly to your invalidation level.
D. Exit rule: Decide where you will exit the trade. Will you exit at a pre-determined profit target, or when the price reaches stop-loss, or the expected move does not happen within a set period?
E. Defined risk: Know how much you are willing to lose at a specific trade. If the trade goes wrong, exit as per the position size and risk amount.
F. Repeatability: A standout characteristic of a successful setup is repetition. The setup must be simple enough that you can spot and execute it the exact same way 50 times in a row without changing the rules mid-trade.
Step 7: Build a Simple Day Trading Plan
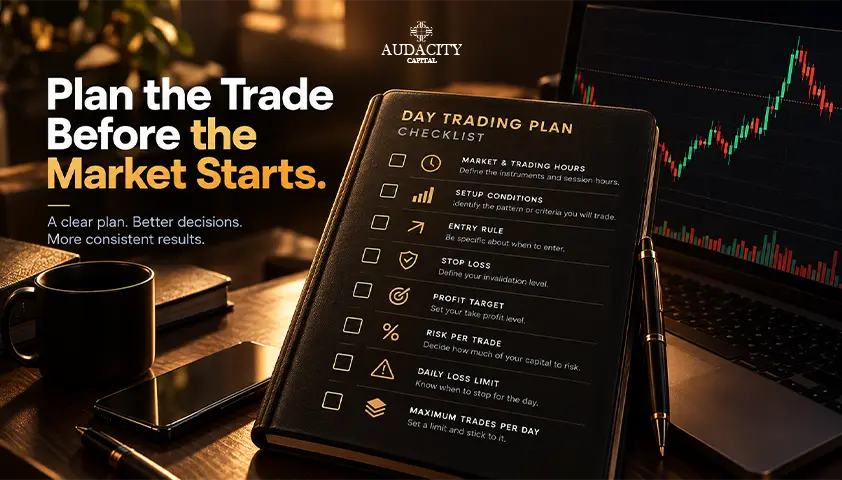
Here are some questions that will help you to get started.
Q1: Market: What will I trade- Stocks, indices or other instruments?
Q2: Trading session: When will I trade- opening hours, closing bell, volatile session, highly liquid setups?
Q3: Setup: What conditions must exist- a breakout, a trend condition, a fall to support levels?
Q4: Entry: What triggers the trade— stocks break above resistance, uptrend in the 15-min timeframe, must make HH and HLs?
Q5: Stop-loss: Where is my trade idea invalid- name the candlestick close, volume condition or level breaks?
Q6: Target or exit: When will I close the trade- at a fixed profit, at a fixed risk/reward ratio, when trade hits stop-loss, or if a certain condition is met?
Q7: Position size: How many shares will I trade?
Q8: Risk-to-reward: Is the potential reward worth the risk?
Q9: Daily loss limit: When will I stop trading- when the losses hit a certain amount or hit a percentage of my account size?
Q10: No-trade conditions: When should I stay out- unclear price movement, no valid setup, unusually wide spreads, important scheduled news, poor liquidity or reaching your daily loss limit?
Step 8: Practise With Paper Trading or a Demo Account
Practicing on paper or a demo account is a good habit before testing the live markets. To practice paper trading, you can:
- Study the markets, assets and understand the price action, volume, volatility, risk to reward using the tools and indicators.
- Practice market orders in volatile markets, limit orders, stop-loss and take-profit orders while deciding entry point.
- Choose one particular setup and follow it without changing your entry rules, stop-loss logic, or profit targets mid-way.
- Calculate exact position size, place stop-loss as per logical setups and not arbitrary lot sizes or round off loss amounts.
- Practice daily loss limits in paper trades to build habits for the real trading environment.
- Practice selected trades rather than overtrading due to boredom, impulse or emotional triggers. This will help to build patience when the markets are boring or idle.
Step 9: Keep a Trading Journal and Review Your Results
A trading journal helps you to analyse and review your trade in a logical manner. Here’s what to record in your trade journal:
- Exact date, time, market type, asset type and overall market condition (bullish, bearish, any chart patterns, etc).
- Market Setups (trending markets, support and resistance levels, chart pattern screenshots)
- Trade Setup (entry point, order type, stop-loss, position size, risk to reward, etc).
- Target or exit point along with:
- (Win rates (percentage of total trades that closed in profit).
- Average Win vs. Average Loss (average currency amount made on winning trades compared to the average currency amount lost on losing trades).
- Rule Adherence Rate (percentage of trades where you followed your plan perfectly from start to finish).
- Market conditions ( before, during and after the trade).
- Results (deviations from every planned metric such as entry, stop-loss, risk to reward ratio, exit and final profit/ loss).
- Screenshots of the trade.
- Whether the rules were followed (did you take the trade when the conditions were met, conditions when the rules were broken, were there any deviations from the original plan in your decision-making).
- Mistakes or emotional decisions (recurring patterns in your errors, emotional triggers, etc.)
A well-executed trade may not generate results. However, it is important to note that the quality of trade must not be compared with the outcome of the trade. Reward yourself for following rules, taking a disciplined approach, logical reasoning, rather than impulse decisions that may generate short-term profits.
Step 10: Know When You Are Ready to Move Beyond Demo Trading
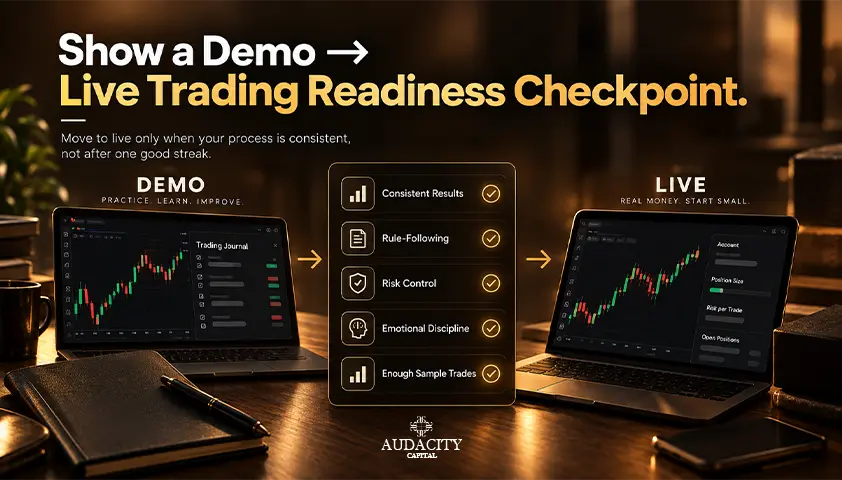
Some might think that making profits in demo trades is enough to start live trading. This, however, is the wrong approach. Traders can assess if they’re ready for day trading if:
For day trading for beginners, moving beyond demo trading should depend on consistent execution and rule-following rather than a short run of profitable trades.
- They no longer hesitate before entering setups that match their criteria and do not invent trades due to boredom or impulse.
- They can understand market, asset, setups and place market, limit, stop-loss, and take-profit orders instantly without double-guessing buttons.
- They can calculate & stick to position size, stop-loss, daily loss limits, etc.
- They have stopped revenge-trading after a loss, moving stop-losses mid-trade, or taking trades out of fear of missing out (FOMO).
- They can handle losing trades,without feeling an emotional urge to alter your strategy after two or three consecutive losses.
How Much Money Do You Need to Start Day Trading?
There’s no dedicated or uniform amount to start day trading. The amount depends upon market and asset type, leverage available, brokerage rules for deposits and margin requirements, and jurisdiction regulations.
But you must also factor in risk appetite, position size, capital available, etc. It is important to keep the essential everyday expenses out of the trading account.
The U.S. FINRA’s new intraday margin framework became effective on June 4, 2026 which eliminates the Pattern Day Trader (PDT - traders executing four or more day trades in five business days) and the $25,000 minimum equity requirement. The brokerage firms, however, have a permitted transition period through October 20, 2027.
Common Day Trading Mistakes Beginners Should Avoid
It's common for beginners getting into day trading to make mistake. Here are some common ones so that you can try to avoid them early on:
Mistake #1: Trading without a plan: An unplanned trade makes you give into emotions and uncalculated decisions, thus risking entry, exit and losses..
Mistake #2: Using too much leverage: Leverage when used ineffectively or when trade goes wrong can generate huge losses even with small price fluctuations.
Mistake #3: Strategy hopping: To change strategies frequently prevents you from collecting data that helps you to review your decisions and hampers their trading process.
Mistake #4: Taking too many trades: Frequent trading adds to the cost of transactions, slippage errors, unpredictable decisions.
Mistake #5: Moving a stop-Loss to avoid accepting a loss: Avoiding stop-loss to avoid a loss turns calculated and planned risk to an unpredictable decision. The chances are you’ll exit with more losses than planned and risk your capital.
Mistake #6: Increasing risk after a losing trade: Traders book more trades to cover losses which leads to risky decisions, more costs, and probably more losses.
Mistake #7: Copying social media trades without understanding: Social media trades do not provide context or logic behind trades. Following such calls blindly can leave you entering after the price has already moved or exiting too late.
Mistake #8: Focusing on daily income targets too early: Market brings no equal opportunities. Setting sights on daily income targets might pressure traders to take unnecessary trades, blind decisions or high-risk.
Mistake #9: Moving to live trading before demonstrating consistency in demo trading: Demo trading is a great practice to control emotions, practice order-booking, planning risks and building healthy habits. Traders who avoid demo trading risk much more than losses.
Conclusion
Day trading might seem complex and intimidating at first, but with a disciplined approach, risk management, and spot-on execution skills, traders can make it easy.
Successful trading is not about a streak of luck to generate profits, rather it comes from following rules consistently, repeating the process and patterns, and consistent execution. Traders must focus to learn, build their knowledge, protect their capital and honor their trading plans.
Frequently Asked Questions About Day Trading for Beginners
Day trading can prove a challenging task for beginners as it requires spot-on decisions, emotional discipline, active monitoring, and high financial risk. It is important to master the day trading basics, the demo trading and then proceed to day trading.
There’s no dedicated time or course that can help a trader master day trading. Instead the time varies depending upon their understanding of markets, setups, sticking to trading plan, following the rules, and consistent strategy.
Yes, a demo account lets you stimulate real-world markets which helps to test your knowledge, practice order types, stop-loss, position sizing and risk management.
There is no fixed number. The trades depend upon whether they meet a trader’s specific criteria or conditions.
No market is easy for day trading as every market is governed by different rules, cost, liquidity and volatility applications, etc. Therefore, it is important to understand the market, assets and conditions firsthand.
Beginners must first focus on learning price charts, support and resistance, and basic market trends before adding indicators such as RSI, moving averages to their course.
Risk amount varies per person. It also depends upon trade setup, account size, and position size. It's better to work backwards, define maximum loss and calculate accordingly.
Move to live trading only when you can follow your plan and strategies consistently, manage risk and position sizes, respect loss limits and control emotional triggers and impulsive decisions.

Ready to apply disciplined risk to crypto? Explore Audacity Capital's new crypto instruments and bring your trading strategy.
Learn MoreNewsletter
Join our newsletter to stay up to date on features and releases.
Join Our Social & Community

Start Your Journey Today With Our Free Trial
Proudly showcase your skills and accomplishments through certificates and get recognition for your hard work and dedication from potential investors and peers.
Free TrialRelated Articles

Swing Trading vs Day Trading: Which Is Right for You?
One style costs you your afternoons. The other costs you your sleep. Here is how swing trading vs day trading really compare, and how to pick.


Trading Psychology for Funded Traders: Pressure, Fear and Revenge Trading
Struggling with pressure and tilt? Master trading psychology for funded traders with concrete systems to avoid revenge trading and stay disciplined.

The First 30 Days: What New Traders Should Focus On (And Ignore)

10 Best Futures Prop Firms for Swing Trading In 2026
Compare the best futures prop firms for swing trading in 2026 with overnight holding, flexible rules, fast payouts, and funded accounts.